This blog post introduces Covid Calculator. This tool allows for interactive data visualization to explore and analyze the potential effects of Covid-19. The tool has been translated into multiple languages and allows users to derive their own country-specific estimates based on current data. It is accessible at:
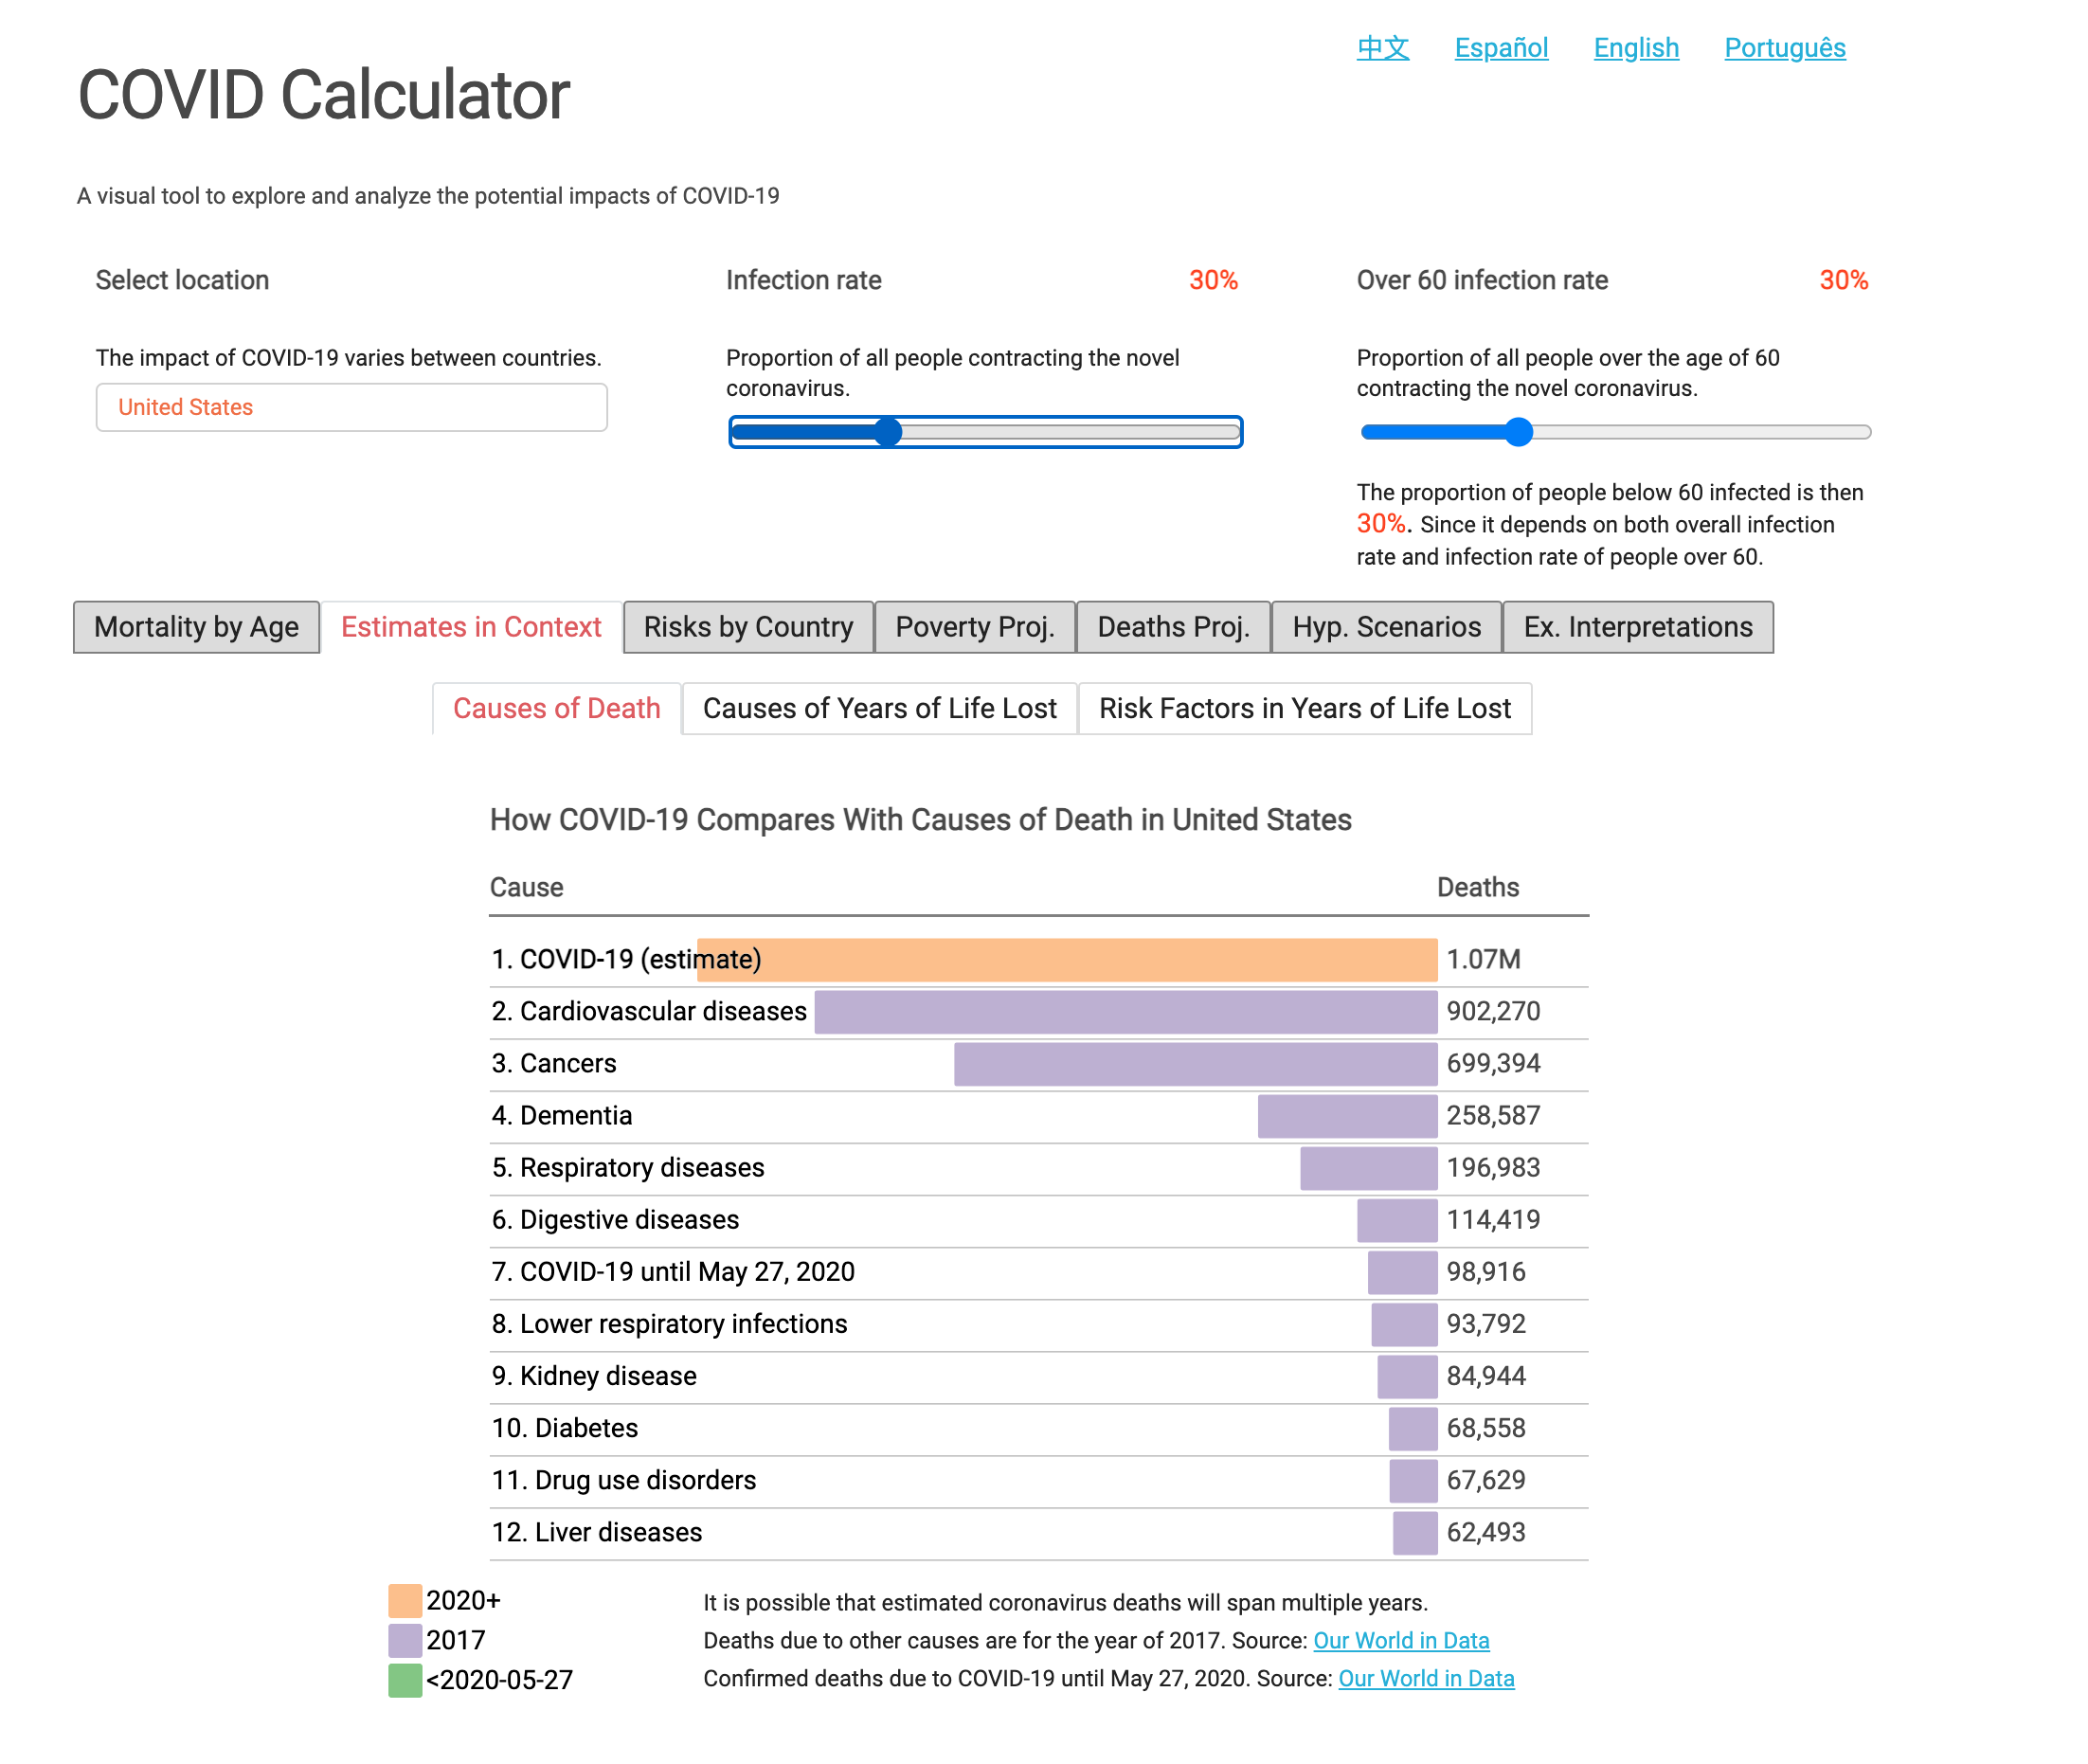
A screenshot of the Covid Calculator is shown in Figure 1. It shows the estimated number of deaths from Covid-19 based on the selected infection rate (30%) and infection fatality rates (N Ferguson & et al., 2020), and how they compare to other major causes of deaths in the US.
It began as a simple bar chart that displayed mortality by age for a selected country. Over time, by adding new features, it evolved into a more complex tool. This blog post is meant to describe technical details.
Disclaimer
The author is not a health expert or an epidemiologist and disclaims responsibility for any adverse effect resulting, directly or indirectly, from information contained in this website. For health, safety, and medical emergencies or updates on the novel coronavirus pandemic, you can get the latest information from WHO or search for official public health information for your country.
Table of contents
- Introduction
- Age structure
- Fatality rates
- Proportion of infected
- Probability of eliminating Covid-19
- Expected number of infected
- Expected number of deaths
- Expected years of life lost
- Actual years of life lost
- Projected costs
- Projected poverty
- References
Introduction
At the time of writing, the impacts of Covid-19 remain largely uncertain and depend on a whole range of possibilities. Organizing the overwhelming mass of the available information and coming up with a reasonable estimates can be challenging. As an attempt to address this problem I used publicly available data to create an online tool called Covid Calculator that allows users to derive their own country-specific estimates.
The tool is focused on simple presentation and pedagogical aspects and only offers crude estimates. It uses relatively simplistic methodology outlined below.
There are lots of improvements possible and more things to consider. One is to also include estimated fatality rates of Covid-19 by pre-existing health conditions. Having time to event data and applying survival analysis techniques would result in a more sensible estimates of expected years of life lost. Allowing parameters to evolve over time and comparing different time spans is another improvement.
Age structure
We denote the number of something with $n(\cdot)$, for example
\[n(\text{people in the world}) \approx 7.59B.\]For selected location population we use data about age from (Pyramids, 2020) and divide it in 9 intervals or age groups:
\[\begin{align*} G = \{ \text{0-9}, \text{10-19}, \ldots, \text{70-79}, \text{80+} \}. \end{align*}\]The size of population $N(g)$ by age group $g$ is estimated by counting how many people fall into each age group $g$:
\[N(g) = n(\text{people in age group g})\]and total population size $N$ is
\[N = \sum_{g \text{ in } G} n(\text{people in age group g}).\]For a more detailed analysis, age groups are divided into two sets
\[\begin{align*} G_{<60} &= \{ \text{0-9}, \text{10-19}, \ldots, \text{50-59} \} \\[.5em] G_{60+} &= \{ \text{60-69}, \text{70-79}, \text{80+} \}. \end{align*}\]The proportion of people over 60 in selected population is calculated as
\[d_{60+} = \sum_{g \text{ in } G_{60+}} N(g) / N.\]Fatality rates
Infection Fatality Rate (IFR), see (N Ferguson & et al., 2020), represents the proportion of deaths among all the infected individuals:
\[\text{IFR} = n(\text{deaths}) / n(\text{infected}).\]Case Fatality Rate (CFR), see (Wikipedia, 2020), represents the proportion of confirmed deaths among all confirmed infected individuals:
\[\text{CFR} = n( \text{confirmed cases of deaths} ) / n( \text{confirmed cases of infected} ).\]By default, the estimates $\text{IFR}(g)$ by age groups are from (N Ferguson & et al., 2020). Users can also choose to use estimates of $\text{CFR}(g)$ by age groups based on data from different countries.
There is a big difference between the two measures. For example if in some particular time frame we have 5 confirmed cases of people infected and 2 confirmed deaths, then $CFR = 2/5 = 0.4$. However, if based on some other data and not only on confirmed cases, we know that there are actually more people infected, than our estimated IFR will be smaller than $\text{CFR}$.
Users can also adjust the fatality rate of each age group by input parameter $F$. It represents percent of increase or decrease.
Fatality Rates $\text{FR}(g)$ by age groups are calculated by multiplying selected estimates of fatality rate for each age group by $1 + F/100$ and used to estimate actual $\text{IFR}$:
\[\text{FR}(g) = \text{*FR}(g) \cdot (1 + F/100).\]Here, $\text{*FR}$ is estimated $\text{IFR}$ or user selected $\text{CFR}$ estimate for a particular country.
Note:
- Since “confirmed cases of infected” is a subset of “infected”, wider testing can reduce $\text{CFR}$ estimates.
- When using $\text{CFR}$, the expected number of deaths in age group 0-9 is always 0 since no children under 10 appear to have died from Covid-19 when this data was aquired.
- Our proposed approach for later estimation assumes that the fatality rate by age in selected location has distribution similar to that estimated by (N Ferguson & et al., 2020) or observed in the country of selected $\text{CFR}$.
Proportion of infected
The selected proportion of infected $H$ is:
\[H = n(\text{infected}) \cdot 100 / N.\]Users can adjust the proportion of infected people over 60 using $H_{60+}$. The overall $H$ can be decomposed as:
\[\begin{equation} H = (1 - d_{60+}) \cdot H_{<60} + d_{60+} \cdot H_{60+} \label{eq: decomposition} \end{equation}\]where $H_{<60}$ is proportion of infected people below 60.
Probability of eliminating Covid-19
Let $A$ be the event of achieving complete elimination of Covid-19 disease before it manages to infect proportion of population $H$. Let $I_{A}$ be the indicator variable for event $A$. Let
\[\begin{align*} E &= \text{Pr}(I_{A} = 1) \cdot 100 \\[.5em] U &= n(\text{infected until elimination}) \cdot 100 / N. \end{align*}\]The proportion of people over 60 infected until elimination $U_{60+}$ is calculated from
\[U_{60+} / U = H_{60+} / H\]and proportion of people below 60 infected until elimination $U_{<60}$ from decomposition (\ref{eq: decomposition}):
\[U = (1 - d_{60+}) \cdot U_{<60} + d_{60+} \cdot U_{60+}.\]Expected number of infected
The expected number of infected in age group $g$ is estimated as
\[\mathbb{E} \left[ n(\text{infected in age group g}) \right] = (1 - E/100) \cdot N(g) \cdot H_{\text{*}} + E/100 \cdot N(g) \cdot U_{\text{*}}.\]Here, * in $U_{\text{*}}$ is either <60 or 60+.
Expected number of deaths
Expected number of deaths in age group $g$ in $G$ is estimated as
\[\mathbb{E} \left[ n(\text{deaths in age group g}) \right] = \mathbb{E} \left[ n(\text{infected in age group g}) \right] \cdot \text{FR}(g).\]Total expected numbers are simply sums over all age groups
\[\begin{align*} \mathbb{E} \left[ n(\text{infected}) \right] &= \sum_{g \text{ in } G} \mathbb{E} \left[ n(\text{infected in age group g}) \right] \\ \mathbb{E} \left[ n(\text{deaths}) \right] &= \sum_{g \text{ in } G} \mathbb{E} \left[ n(\text{deaths in age group g}) \right]. \end{align*}\]Expected years of life lost
For this, the life table for global population (WHO, 2020) with estimates about expected number of life years left for all ages in 2016 was used. For example, a person at the age of 60 had 20.5 expected number of life years left in 2016.
Next, by taking the average by gender and by age in a specific 10 year age group as an estimate of life expectancy of individual from a particular age group, calculate $\text{life exp}_g$. Finally, estimate expected years of life lost (EYLL) due to Covid-19 as:
\[\text{EYLL} = \sum_{g \text{ in } G} \mathbb{E} \left[ n(\text{deaths in age group g}) \right] \cdot \text{life exp}_g.\]Actual years of life lost
Years of life lost are estimated from confirmed deaths due to Covid-19 in the following way. First, calculate mean $\text{CFR}$ by age group from all the $\text{CFR}$ estimates by age group from countries as presented in Table 1.
| CFR | 0-9 | 10-19 | 20-29 | 30-39 | 40-49 | 50-59 | 60-69 | 70-79 | 80+ |
|---|---|---|---|---|---|---|---|---|---|
| China | 0.0 | 0.2 | 0.20 | 0.20 | 0.40 | 1.3 | 3.6 | 8.0 | 14.8 |
| Korea | 0.0 | 0.0 | 0.00 | 0.11 | 0.08 | 0.5 | 1.8 | 6.3 | 13.0 |
| Italy | 0.0 | 0.0 | 0.00 | 0.30 | 0.40 | 1.0 | 3.5 | 12.8 | 20.2 |
| Spain | 0.0 | 0.0 | 0.22 | 0.14 | 0.30 | 0.4 | 1.9 | 4.8 | 15.6 |
| Mean | 0.0 | 0.05 | 0.105 | 0.1875 | 0.295 | 0.8 | 2.7 | 7.975 | 15.9 |
Next, let $D$ be the event that a person died from Covid-19 and let $A_g$ be the event that this persons age is in the age group $g$. If there is $n(\text{deaths})$ in selected country from Covid-19, estimate years of life lost (YLL) due to Covid-19 as:
\[\text{YLL} = n(\text{deaths}) \cdot \sum_{g \text{ in } G} Pr(A_g | D) \cdot \text{life exp}_g\]The probability of a person who died in a particular country being in age group $g$ is estimated as
\[Pr(A_g | D) = \frac{Pr(D | A_g) Pr(A_g)}{P(D)}.\]Here,
\[\begin{align*} Pr(D | A_g) &= \text{estimated mean } \text{CFR}_g \\[.5em] Pr(A_g) &= \text{proportion of people in age group } g \text{ in particular population} \\[.5em] Pr(D) &= \sum_{g \text{ in } G} Pr(D | A_g) Pr(A_g). \end{align*}\]Example
For example, in Italy there were 24114 confirmed deaths from Covid-19 until the end of May. Based on the demographics and life expectancies of Italy, we estimate 294369.66 years of life lost in Italy from Covid-19.
Projected costs
A figure of $129,000 represents what it would cost to give a person an additional quality-of-life adjusted year of life (Staff, 2020). This figure is multiplied with years of life lost to get estimated costs or money saved.
Projected poverty
Take the difference between the IMF’s GDP growth forecasts (Fund, 2020) for April 2020 and forecasts from October 2019. We take estimates of how many people lived in extreme poverty (income below $1.9 per day) by country from 2015 from World Bank (Bank, 2020). Then estimate the projected poverty increases by country due to Covid-19 by multiplying this number and subtract the difference in GDB growth forecasts.
Example
For example in Nigeria the difference between IMF’s GDP growth forecasts is –5.9 percent and World Bank estimated that there were 85.15 million people living in extreme poverty. So we estimate there will be
\[5.15M (5.9 / 100) \approx 5.02M\]additional people living in extreme poverty in Nigeria due to Covid-19 pandemic.
Note: This are crude estimats of Covid-19 effect on poverty because not only Covid-19 pandemic has caused the IMF to alter its forecasts.
References
- N Ferguson, D. L., & et al., G. N. G. (2020). Report 9: Impact of non-pharmaceutical interventions (NPIs) to reduce COVID19 mortality and healthcare demand. https://doi.org/10.25561/77482
- Pyramids, P. (2020). Population Pyramids of the World from 1950 to 2100. https://www.populationpyramid.net/
- Wikipedia. (2020). Case fatality rate. https://en.wikipedia.org/wiki/Case_fatality_rate
- WHO. (2020). Life tables. https://apps.who.int/gho/data/view.main.LIFEREGIONGLOBAL
- Staff, S. G. S. B. (2020). How much will we pay for a year of life? https://www.gsb.stanford.edu/insights/how-much-will-we-pay-year-life
- Fund, I. M. (2020). World Economic Outlook, April 2020: The Great Lockdown. https://www.imf.org/en/Publications/WEO/Issues/2020/04/14/weo-april-2020
- Bank, T. W. (2020). Poverty headcount ratio. https://data.worldbank.org/indicator/SI.POV.DDAY